When a seeding campaign wraps up, this is usually the kind of number that's left.
"30 videos, 1.2 million total views, 30,000 likes."
It looks big. But it doesn't tell you what to do next. It leaves out which videos actually moved people and which messages to scale.
That's why people say seeding is hard to measure. We see it differently. If it can't be measured, design it so it can be.
1. Views tell you how much it was shown
On TikTok, views are largely the result of how many feeds the algorithm pushed a video into. They swing widely with creator size, upload time, and plain luck on the day.
Likes are similar. A like takes one tap. It means someone enjoyed the video, but it doesn't tell you whether they intend to do anything.
2. Saves and shares tell you what happens next
People tap save and share for different reasons.
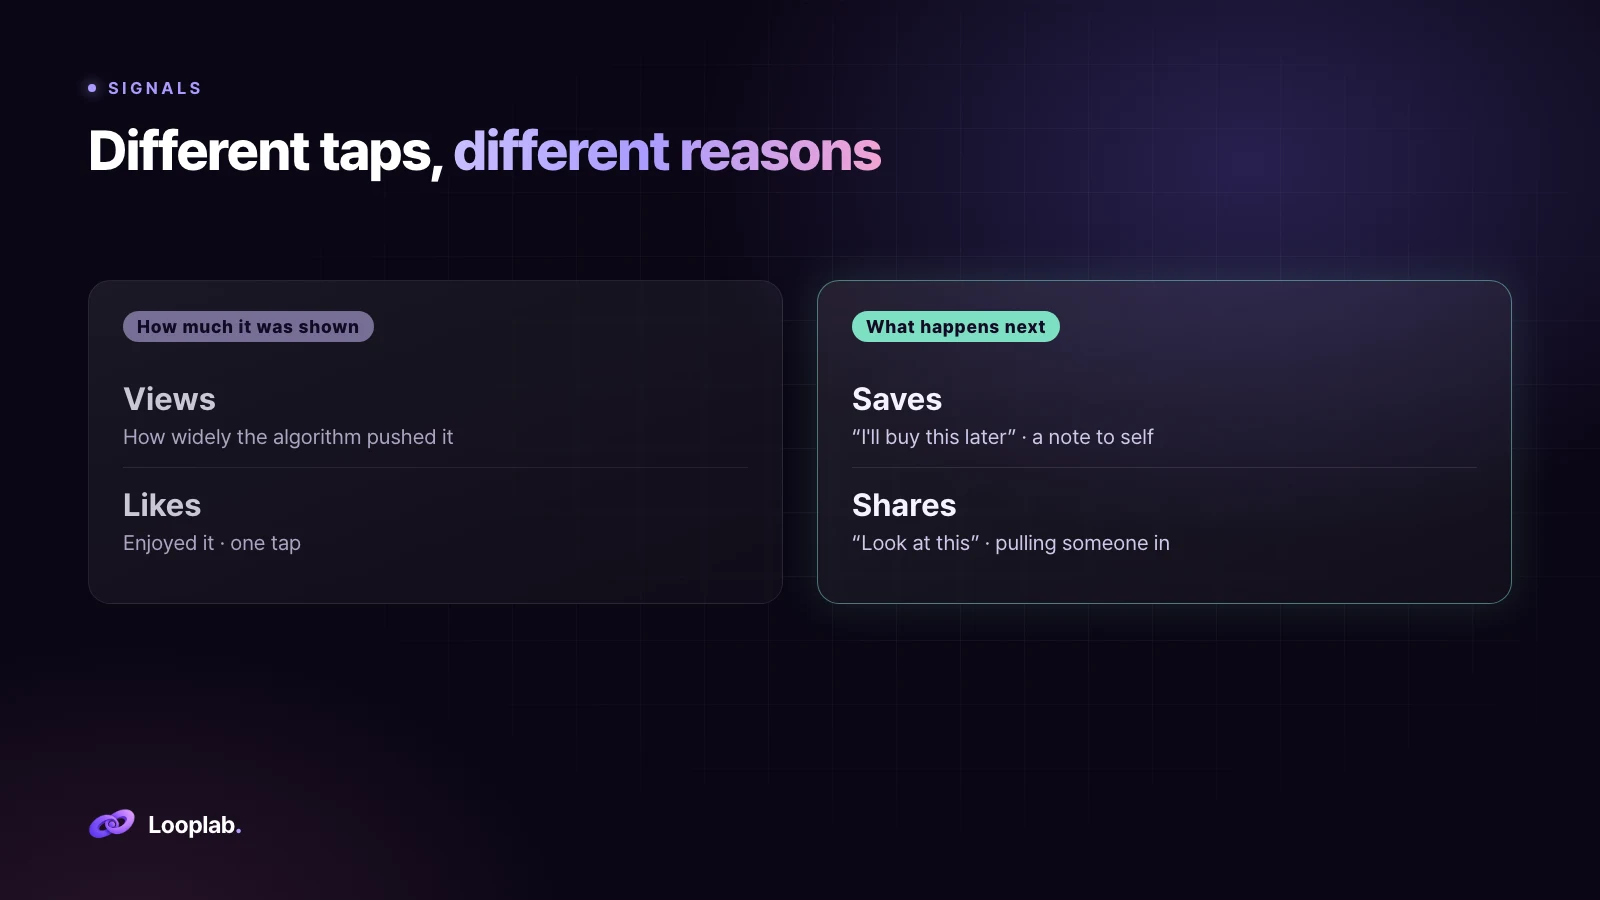
A save means "I'll buy this later" or "I should go there." It's a note to self.
A share means "Look at this" or "Let's go together." It's a recommendation that pulls someone else in.
Both are tapped after watching, with a next step in mind. They're the signals closest to real action, including purchase.
3. How action rate is calculated
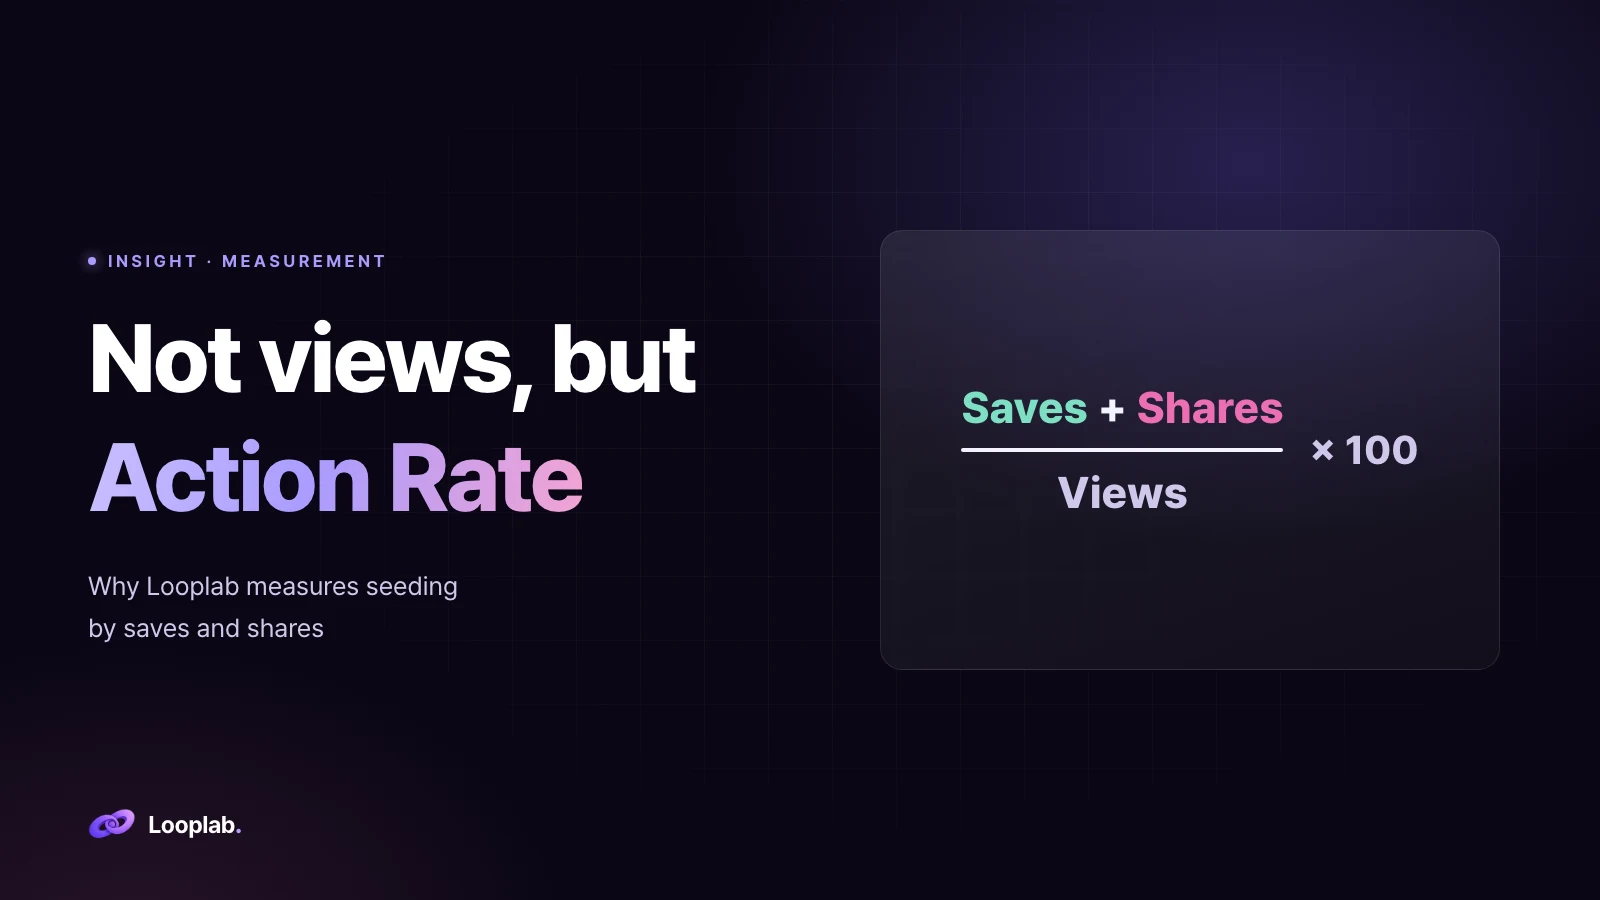
Looplab combines saves and shares into a metric we call Action Rate.
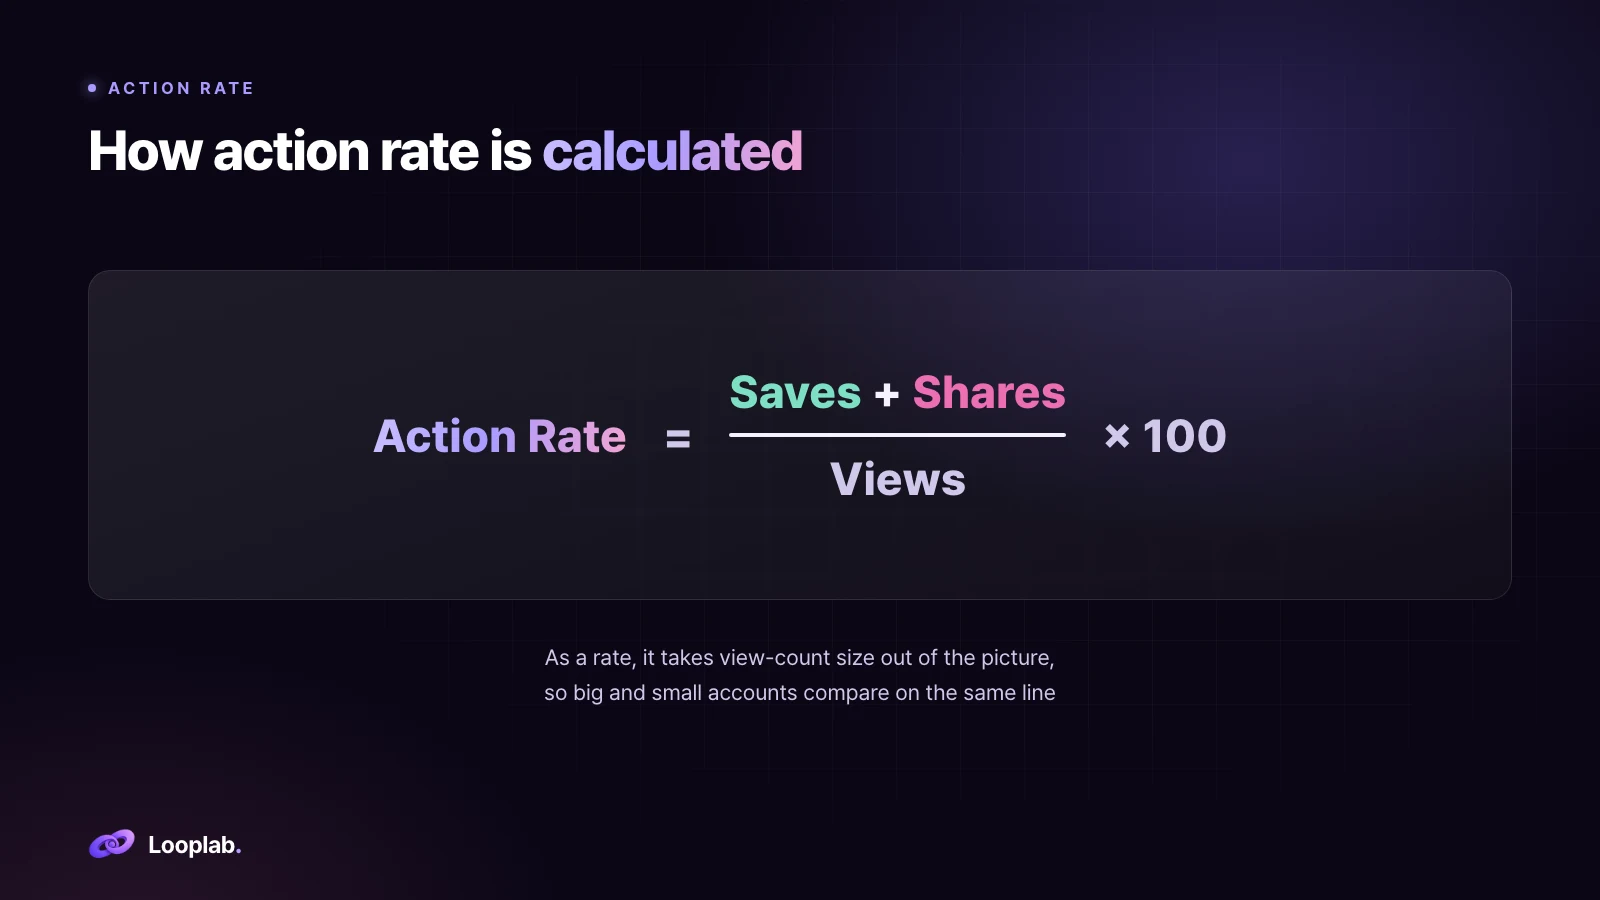
Action Rate = (Saves + Shares) ÷ Views × 100
We use a rate to take the size of the view count out of the picture. That way, videos from creators with many followers and few followers can be compared on the same line.
4. Ranking by views is not ranking by action
Here's what happened in the first stage of a food brand's campaign.
One video had the second-highest views. Another had less than half as many. When we looked at the save rate, the second video was eight times higher.
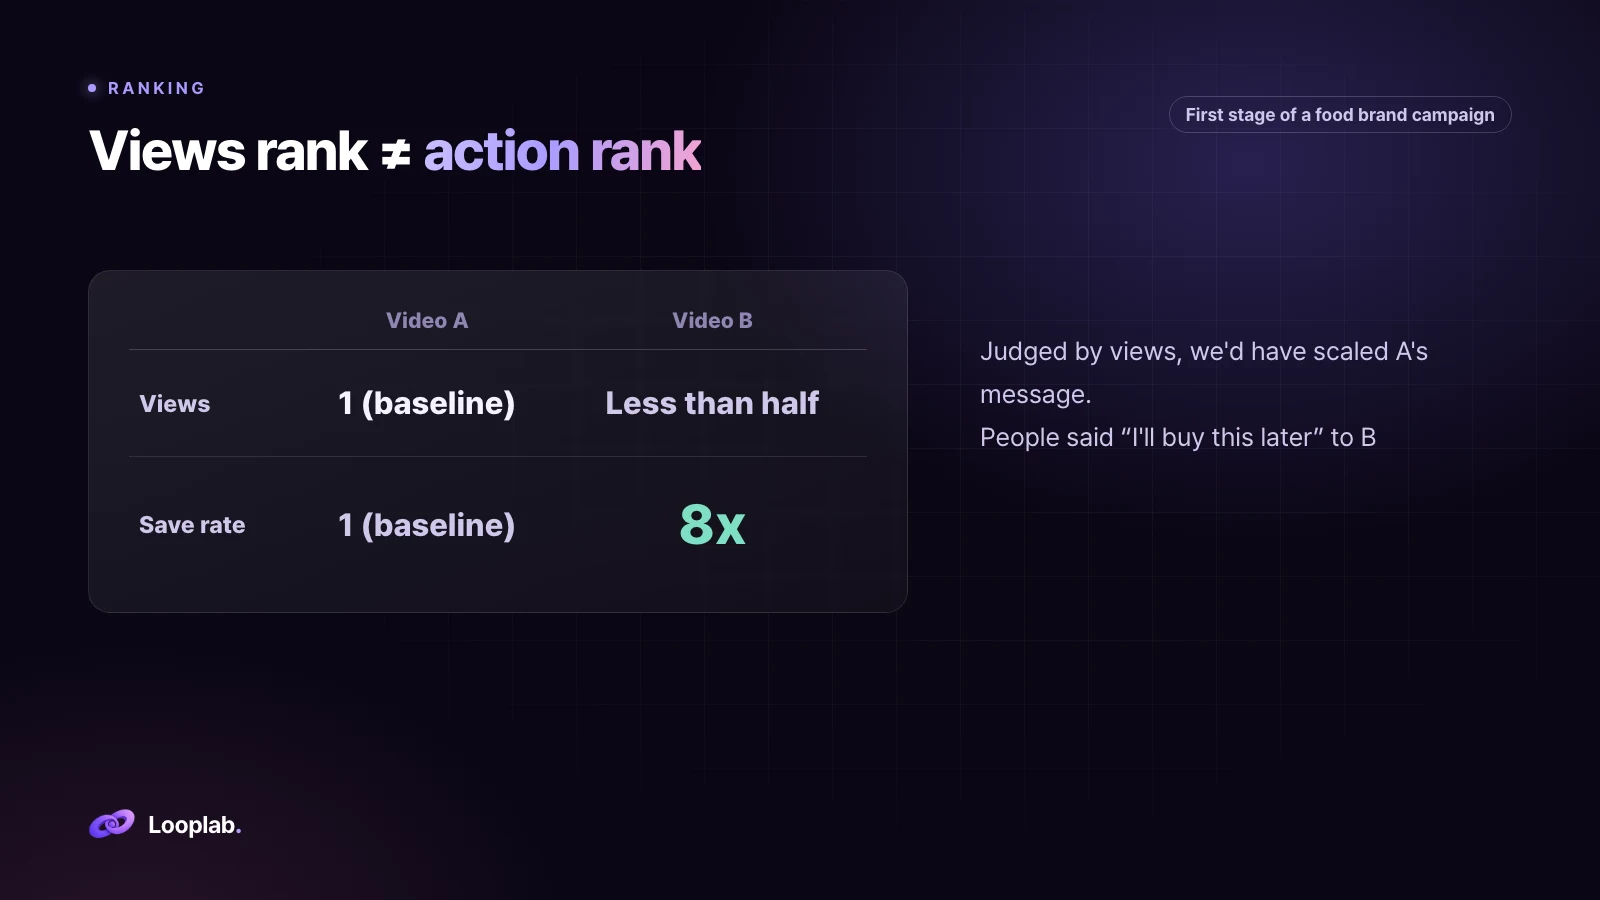
If we had judged by views alone, we would have scaled video A's message. But the one people reacted to with "I'll buy this later" was video B. That gap changed the message and the creator selection for the next stage.
5. Three decisions action rate changes
Action rate isn't a metric for making results look good. It's a metric for making the next decision.
Which message to scale — Seeding means putting several messages out into the market. The message of the videos with the highest action rate becomes the standard for the next campaign and the product page. (Seeding Starts With the Message)
Which videos to boost as ads — When picking creatives to scale with Spark Ads, we look at action rate together with watch metrics, not views. (Creator Videos Held Attention Longer Than the Brand's Own Ads)
Which creators to work with again — Creators of different sizes play different roles: small creators bring volume, mid-tier creators bring spread, and mega creators bring trust. Compare action rate within the same size tier, and you'll see who to work with again.
6. How we read it in the performance sheet
Put action rate before views. Column order is decision order.
Compare at the same point after upload. Putting a one-day-old video next to a week-old one skews the comparison.
Track by date. Organic reach usually slows down fast within a few days of upload. Decide in advance when you'll stop and judge.
We cover how to build the performance sheet in detail in "You Even Caught That?" Draft Reviews and Performance Sheets That Win Clients Over.
7. Things to watch out for
With too few views, the rate jumps around. 3 saves on 100 views is 3%. Compare only videos above a certain view count.
Benchmarks differ by category. Food spots and travel tend to get more saves, while funny content gets more shares. That's why we use it for relative comparison within the same campaign rather than against industry averages.
Look at saves and shares separately, too. A video with many saves and a video with many shares serve different purposes. One is closer to the pre-purchase stage, the other to spreading.
If it's hard to measure, design it so it can be measured
The result of seeding isn't the number of videos or total views. It's which messages people responded to with a next step.
Looplab decides what to measure from the moment we design a campaign. That's how we can answer "So what should we do next?" when the campaign ends.